Fall Ultrasound Pearls
Fluid Assessment using Ultrasound - Diastology
The decision of whether to give or not give more fluids is frequent topic in the emergency department. This is particularly true in the septic patient who has already received fluids and the provider is now having to consider starting vasopressors and placing a central line. We are all familiar with the short and long terms risks of central line placement and vasopressors, so optimizing other options, particularly fluid administration is ideal before pursuing these options. Ultrasound is frequently used to make these decisions, but like many learners what I initially learned about its use is incomplete and lacking strong data. This post will mainly be about diastology or determining diastolic dysfunction using ultrasound. Other aspects of fluid assessment are discussed, but not in significant detail.
Does this even matter?
Yes, in fact up to 38% of patients with sepsis will have signs of diastolic heart dysfunction from elevated filling pressures, whereas only 9% will have systolic dysfunction. Read more here.
Subxiphoid / IVC Ultrasound

I was taught that a collapsing IVC that varies with respiration was a good sign that a patient could use more fluids. I was also taught this data was mostly from the ICU in ventilated patients. This is true and as I explored the data, attempts to validate this data have not been able to reproduce its early success. This is discussed in great detail on Paul Marik’s post on the emcrit website, so I will not try to recreate it. However, the short story is that assessment of IVC diameter and variation with respiration, particularly in the non-ventilated ED patient is likely not much better than a coin flip (if even that good).
A different way of thinking about fluid assessment
After watching episode 141 from the ultrasound podcast I have started thinking of fluid assessment in the ED patient using ultrasound by asking two main things. I start by asking if my patient has evidence of fluid tolerance vs intolerance. If my patient has evidence of fluid intolerance I then move on to the more difficult question of fluid responsiveness.
1.) Fluid Tolerance vs Intolerance
Does giving more fluids to the patient harm them? Using the Frank Starling Curve as a visual, the question of fluid tolerance is really asking what side of the red line they are on. This is a more static and easily achieved question to answer and will be explored more below.
2.) Fluid Responsiveness
Usually defined as an increase in cardiac output of 10-15% with a fluid bolus or passive leg raise. The answer to this question is more difficult to obtain and requires serial measurements before and after an intervention. It is typically done using the apical four chamber view and using the aortic outflow tract diameter and VTI to calculate an estimate of the cardiac output. This is not usually for beginners, has the potential for errors, and requires more time. EMRA has a good article explaining it here. On the Frank Starling Curve this is portrayed by the change in y axis with an increase on the x axis (fluid challenge / PLR). Read more here.

Fluid Tolerance vs Intolerance
The way I see it there are four main things to consider when evaluating a patient for fluid tolerance. Each piece of evidence helps you build the case for your ultimate decision. Dr. Enyo Ablordeppey explained it like using the fingerprint function on your iphone. When you get a new iphone it asks you to move your fingerprint around in different places to verify its you. Obtaining more evidence by looking at various aspects of cardiac function/dysfunction will help you make a more accurate and reliable decision on fluid tolerance vs intolerance.
Four pieces of evidence to obtain when evaluating a patient for fluid tolerance/intolerance:
1.) Right Sided Filling Pressures: IVC evaluation of the central venous pressure
2.) RV function: TAPSE and RVS’
3.) LV function: Ejection Fraction (EPSS and Fractional Shortening)
4.) Left Side Filling Pressures: E:A ratio + E/e’ (Diastology).
This is what the remainder of this post will be about
**B Lines - note that this likely reflects both left side filling pressures and LV function.

Building evidence for fluid tolerance and intolerance.
Diastology - Evaluating Left Side Filling Pressures.
The remainder of this post is on diastology, or in other words, evaluating the left sided filling pressures of the heart. I think this is an important consideration that is often not considered. However, as we extrapolate information and evidence from our evaluation and extrapolate it to physiology we can see that estimating the LVEDP is a key piece of information that requires less assumptions that looking at the IVC and its collapsibility.

extrapolating information from our ultrasound to apply it to the Frank Starling curve.
Obtaining the images
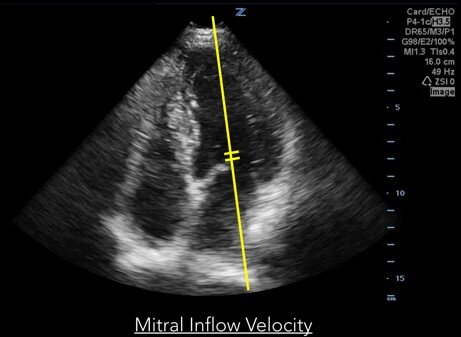
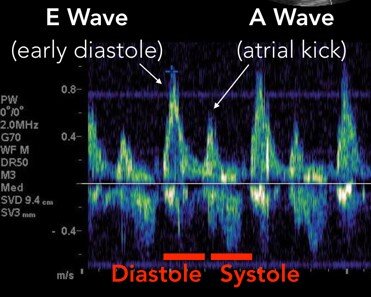
1.) To obtain the E and A wave use the pulse wave doppler to measure mitral inflow velocity.
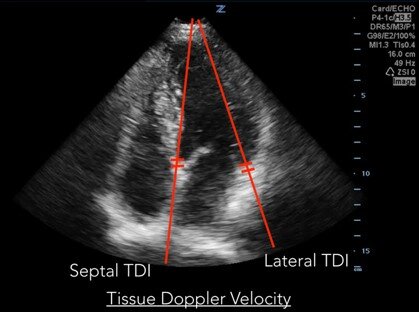
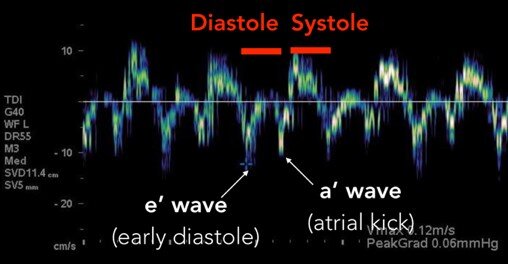
2.) To obtain e’ and a’ use the tissue doppler velocity on both the medial and lateral annulus. Note that you can obtain just one, but an average of the two is preferred when possible.
For a deeper understanding of how to obtain these images, why the tracings look the way they do, and a little more information on diastole and diastolic dysfunction see this ACEP article.
What to do with this information?
Once you’ve successfully obtained the images and measured E, A, and e’, you can use this information to estimate the degree of diastolic dysfunction. I think in the setting of fluid administration it might be more helpful to think of it as elevated filling pressures. I really like the image below, which is taken from the Pocus101 website and altered for my presentation because I think it summarizes everything really well. Note the progression of diastolic dysfunction / elevated filling pressures.

ICU data also suggests that perhaps E and e’ could be used to estimate left atrial pressure with this formula:
E/e’ + 4 = Left Atrial Pressure (LAP).
If you note on the chart above when the E/e’ ratio is > 8 you enter grade 2 diastolic dysfunction. It is at this point that I consider this patient to have signs of fluid intolerance from the perspective of left sided filling pressures of the heart. Using this information along with remaining images of the heart to get a global picture of the ejection fraction, right sided function, presence or absence of B lines, etc. I then make a decision to pursue a fluid challenge and attempt to measure fluid responsiveness or perhaps even starting vasopressors and placing a central line.
Finally, please enjoy a schematic I made for this presentation that incorporates how I view the role of diastology in fluid assesment.

FOAM for MORE:
US podcast: VTI/passive leg raise, IVC(Volume tolerance), US for fluids in sepsis
EMdocs: discussion on multiple ways
Don’t do it? Link - Paul Marik discusses why IVC is not very good and provides the data to back it up.
ACEP: Link:
POCUS 101: link - good walk through and how to use clinically - excellent read
Article link with good discussion and cases
Pulm cc discussion with good pictures: link
Article discussing these topics: link
Article discussing relationship with sepsis and diastolic dysfunction with mortality
US podcast: diastolics: part 1, part 2, part 3
Part 1 = introduction
Part 2 last ten minutes has some clinical examples
Part 3 = practice on a resident.
Authored: John Schneider PGY4
Special Thanks: Enyo Ablordeppey MD.